Account usage data
Last updated: Jul-05-2024
There are a few locations in the Cloudinary Console where you can view statistics, graphs, and other important information about your account usage. In addition, you can receive account usage information via an email notification.
Dashboard
You can view a variety of summary details and trend graphs covering your overall account usage in terms of transformations, total assets, used storage, and used bandwidth. You can also view all add-ons you've registered to, and your current plan and usage on each.
This information is displayed just below the Product Environment section in your Dashboard.
To navigate to your Dashboard, make sure Programmable Media is selected in the Product Selector located at the top left of your Console, and select Dashboard from the Product Navigation menu.
The following sections describe the data available on your Dashboard and how you can leverage that information.
Plan Current Usage
View your current plan and its credit details, including your monthly bandwidth, storage and transformation quota. See how much of your month's credit you've already used up to help you plan the rest of the month's activities, or to decide to upgrade your plan, which you can also do here.
Usage Overview
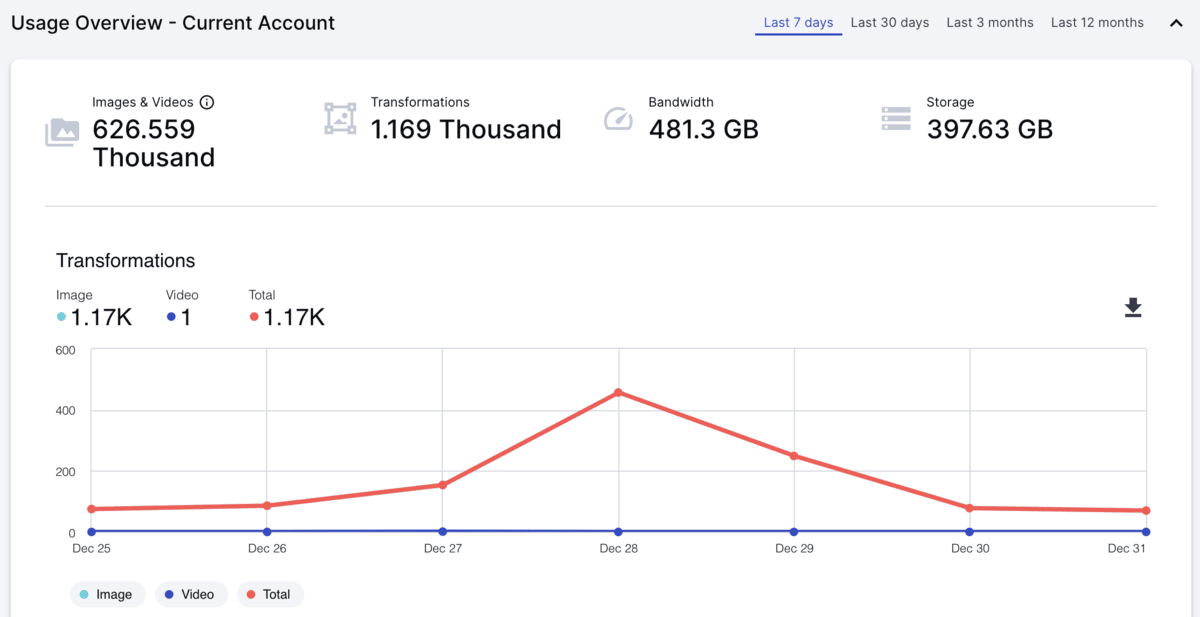
Learn how many transformations, how much bandwidth and how much storage you've used over a selected period of time:
- Across your entire account:

- Within your selected product environment:

Data per product environment is presented on a more granular level and usage is presented per asset type. For example, you can see how many of the total transformations consisted of images or videos.
Error Summary
See how your errors are distributed across the different error types during a selected period of time. Use this information to alert you to problem areas that you should focus on.
For example, if you have a disproportionately large number of 401 - Unauthorized errors, you might choose to check why your system is experiencing so many unauthorized attempts.
Click Go to Error Reporting to view the errors graphed over time. You can also see all the errors that were reported on a specific date, which can also help you pinpoint problem areas.
Reports
Delivery Reports
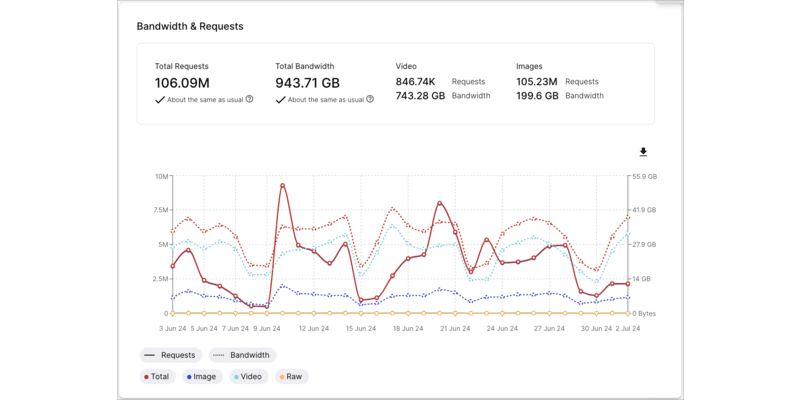
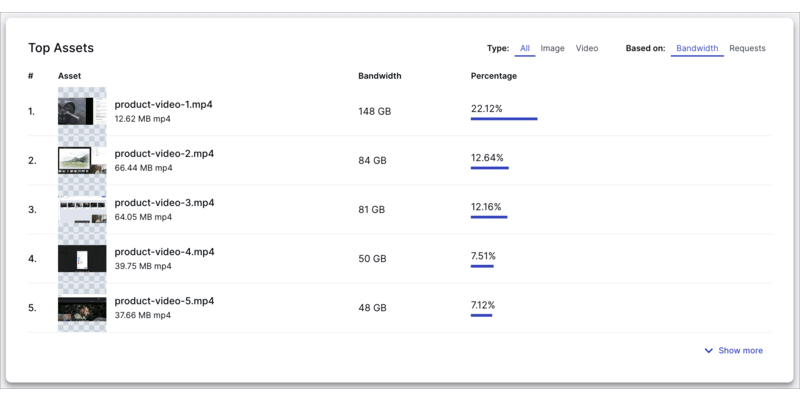
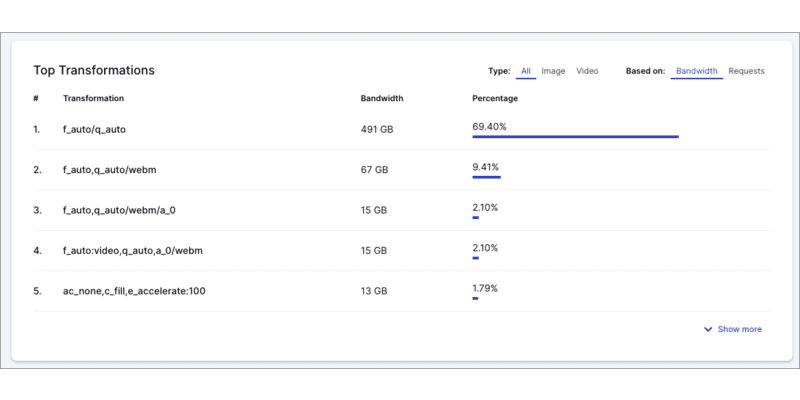
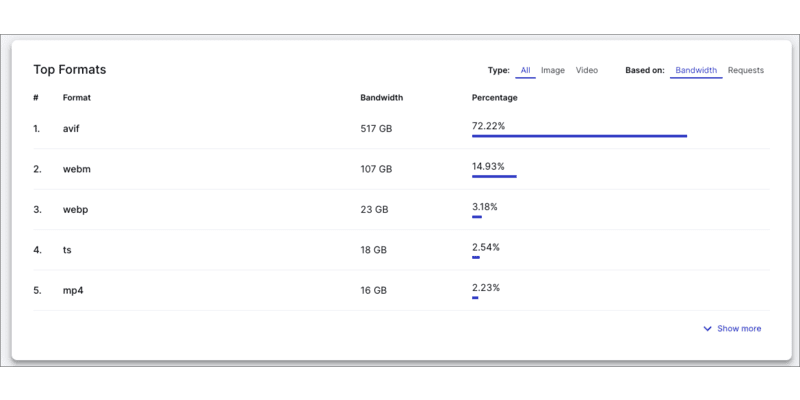
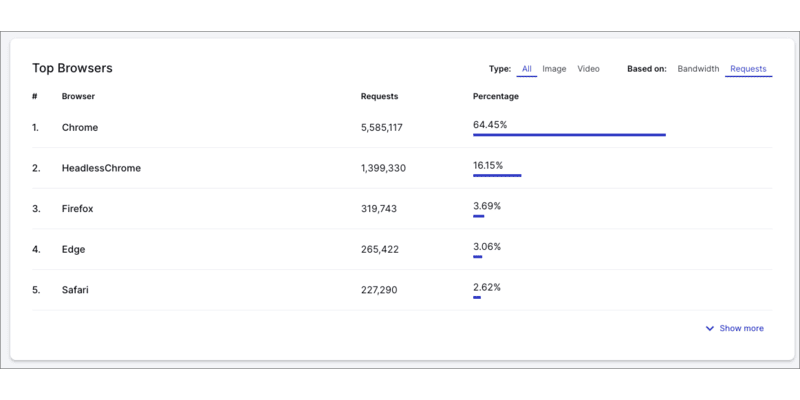
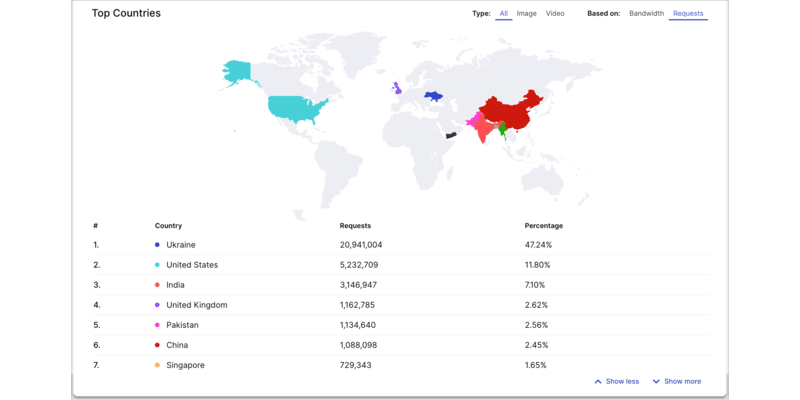
The Delivery Reports page has a large variety of usage details that can help you to analyze how your users are interacting with your published assets.
To view your delivery reports, select Programmable Media from the Product Selector located at the top left of your Console, and select Delivery Reports from the Reports menu.
The images below show just a few of the items provided in the report:
- If you see that N/A is one of the top listed referrers in the Top Referral Domains or Top Referral Pages reports, this means that the requests arrived without a value in the HTTP
Referrerheader, and as a result there's no data available for use in the report. This makes it difficult to give a precise answer for where the requests came from. - The Top Browsers report is based on the HTTP User-Agent header, which is used in HTTP requests to identify the browser or other software that was used to make the request.
Error reports
This report shows you any errors that were generated from API calls or delivery URL requests to your product environment.
You can export an error report for a specific day by selecting the date and clicking the Export to CSV link. An email is sent to you with a link to download the error report in CSV format.
Video Analytics
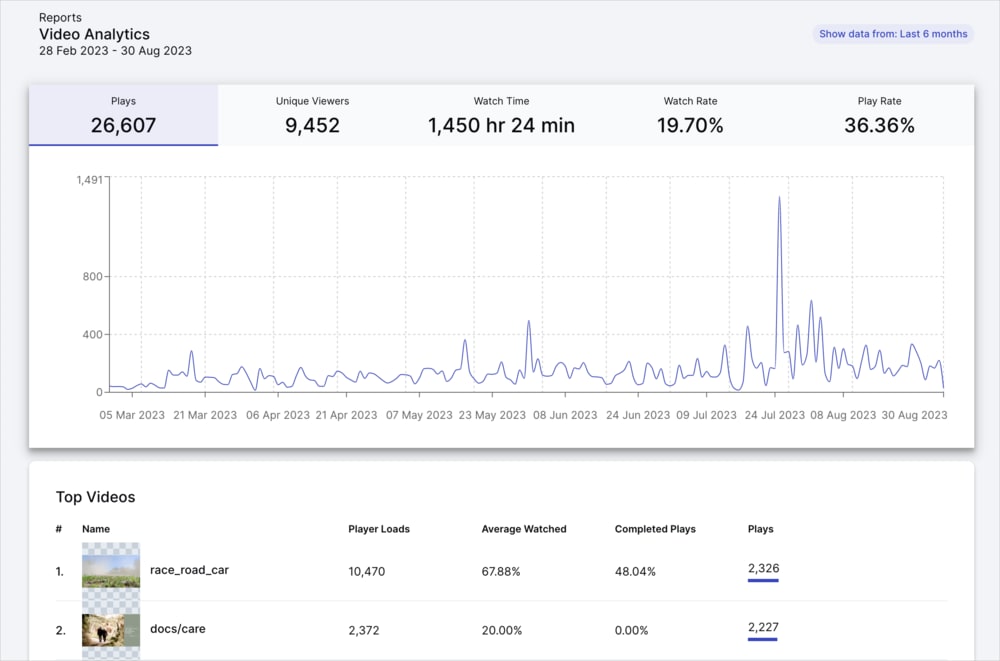
Video Analytics can be used to understand and optimize your video content served by Cloudinary. The metrics are automatically collected for all videos delivered through the Cloudinary Video Player.
1.9.9.You can access the analytics by opening the Video sub-menu and selecting Analytics. Here, you will be presented with a set of metrics and graphs that show how your video content has been delivered.
Learn more about Video Analytics and how to use them.
Usage limits and notifications
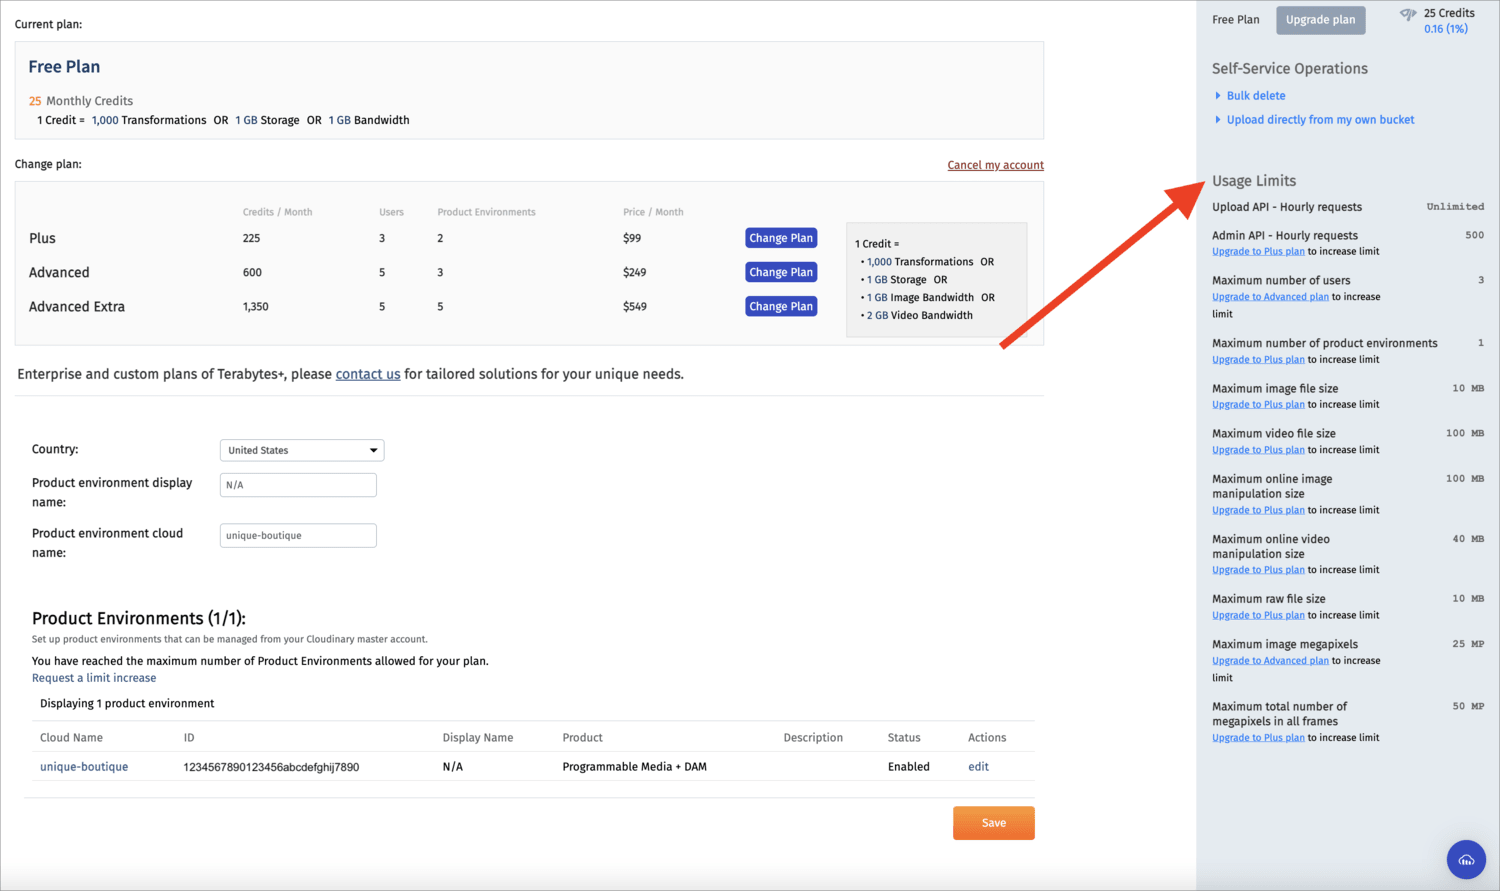
You can easily view the limits of your current plan, upgrade to a new plan and choose to receive notifications about your usage.
Usage limits
To view your current plan and limits or upgrade to a new plan, click the Settings icon in the Console Options sidebar and select the Account page.
Usage notifications
To receive monthly account usage reports by email, select the account usage report option in your Console Settings under My Profile > Email Preferences.
Users on an Enterprise plan can also opt to be notified when account usage exceeds a specified percentage threshold.
DAM usage data
You can view your DAM usage data by generating Activity Reports.
To generate an Activity Report, select Digital Asset Management from the Product Selector located at the top left of your Console, and select Activity Reports from the Product Navigation menu.
The Activity Reports include:
- All account management activities performed in your DAM, for example user management and product environment management actions.
- All actions performed on tracking-enabled product environments in your DAM, for example uploading and deleting assets, updating metadata, adding assets to collections, etc.
To access your DAM Activity Reports, from the Product Selector located on the top left of the Console, switch to Digital Asset Management and select Activity Reports from the Product Navigation menu.
For more information, see DAM usage data.
 Programmable Media
 Digital Asset Management


